This is an entry for a Forex product called Nova Code Trader. The official site for this product is at novacodetrader.com. If you’re looking for more info about this product follow the link.
trading strategy
21 Trading Systems
This is an entry for a Forex product called 21 Trading Systems. The official site for this product is at 21-trading-systems.com. If you’re looking for more info about this product follow the link.
Turtle Trading Rules That Made $100 Million

Are great traders born or are they made? This is the most important question that comes to the mind of anyone thinking of taking trading as a profession. This exactly was the topic of discussion between Richard Dennis and William Eckhardt, two great traders. Richard said that good traders are made and not born while Bill thought that good traders were only born.
Currency Correlations in Forex Trading
Everything in the currency market is interlinked to some extent. Most of the currency pairs show correlations. Knowing about these currency correlations is important for you in order for you to reduce risk and diversify your portfolio. This knowledge of currency correlations will help you diversify and double up your investment portfolio without having to invest in the same currency pair plus also reduce your exposure to the market.
Bad Risk Management in Forex Trading
Bad risk management can create stress and ruin your forex trading career. You might have the best forex trading system in the world but it will fail if you don’t practice good risk management. Losses are inevitable with any forex system. But what if you have bad risk management? You will blow out your account soon and most probably don’t have enough money to make those profits that you had dreamed when you started trading forex.
Bad risk management is one of the main reason that fails the budding career of many new forex traders. Many people start trading forex dreaming of making a million in just a few months. They overtrade, take on too much risk and get blown out by the market.
Keep A Trading Journal
Why you need to keep a trading journal? Trading is all about being disciplined. Successful traders don’t have any holy grail of systems or indicators. What they have is a lot of common sense and discipline. The importance of keeping a trading journal cannot be overemphasized if you want to become a successful trader. This is how hedge fund managers train their new traders. No doubt, leading banks are able to train and breed successful and pro traders using this simple strategy of inculcating the habit of keeping a trading journal and being disciplined in trading.
Importance of Timeframe Coordination in Forex Trading
Using the higher timeframe to confirm a trading signal on a lower timeframe is a skill that can be highly rewarding for a trader. Many traders take a trade that is coordinated on the lower timeframe but not the higher timeframe which often gives them bad trades and a waste of time and energy.
Suppose, you find the trend on the intraday chart and the trend on the daily chart in the same direction, it is like having the wind at your back.If you can master the art of identifying currency pairs that have the intraday trends in the same direction as the daily and the weekly trends, you can reap immense rewards.
Forex Fortune Signal
This is an entry for a Forex product called Forex Fortune Signal. The official site for this product is at forexfortunesignal.com. If you’re looking for more info about this product follow the link.
Breakout Trading Entry, Exit and Stop Loss Strategies
Breakout trading can be highly profitable. But the problem is most breakouts tend to fail often. A breakout fails when the price returns to a point before the breakout. Suppose the price breaks out above the resistance line but soon retraces back below the resistance line. This means the breakout was false. But in many cases, prices retraces itself slightly above or below an important breakout level before continuing in the direction of the breakout.
Divergence Trading With MACD Histogram
Divergences are considered to be pretty strong trend reversal signals. Divergence happens when the price action and the indicator in this case the histogram moves in the opposite directions. For example, the price action makes a new high while the indicator makes a new low or the price action makes a new low while the indicator makes a new high.
When divergence between the price action and the indicator develops, it means a potential trend reversal in the market. MACD is a very versatile technical indicator that can be used to trade these divergence patterns.
How To Trade With The MACD Histogram
A MACD Histogram is a bar chart. The slope of the MACD Histogram is very important. This is the best indicator that tells whether bears or bulls are controlling the market. An upward slopping histogram indicates that the bulls are getting stronger while a downward sloping histogram indicates that the bears are getting stronger.
The price trend whether up or down is likely to continue if it is in the same direction as the slope of the MACD Histogram. When the slope of the histogram and the price action are moving in opposite direction, it means that the trend is in jeopardy. As a rule, always try to trade in the direction of the slope of the histogram.
Rover North Forex System
This is an entry for a Forex product called Rover North Forex System. The official site for this product is at rovernorthforexsystem.com. If you’re looking for more info about this product follow the link.
Forex Trading Pro System
This is an entry for a Forex product called Forex Trading Pro System. The official site for this product is at fxtradingprosystem.com. If you’re looking for more info about this product follow the link.
Fibonacci and Online FX Trading
Fibonacci and Online FX Trading offers the capacity not only to react promptly to market change but to react using an online platform which has the necessary strategic resources. The Fibonacci pattern is a well regarded mathematical sequence and can be applied to the forex way of thinking.
The foreign exchange market, aptly known as forex is the biggest financial market in the world and as a result the sheer level of variables, opens a vast array of possibility regarding technical analysis and trading patterns.
Trend Trading With Bollinger Bands
Do you know this fact that the Bollinger Bands can be used as a very effective tool for detecting and trading trends even though most of us have only be taught to use them in a range bound market. Here is how to capture the trend with Bollinger Bands (BBs). Bollinger bands are used to measure the deviation or what we call volatility in the market. Bollinger bands measure the standard deviation of price action away from its 20 period moving average.
Deciding on a Lot for Your Forex Trading
As a Forex trader, your natural desire is to reduce risks as much as possible. Inevitably, you develop risk management strategies to combat the side-effects of risky trades. In doing so, Forex traders must pay close attention to the size of their lots. Forex strategists assert that the smaller the lot size is, the better, consequently boosting flexibility and overall risk management. So what are the types of Forex slots? Forex slots come in three forms: 1) Micro Lots, 2) Mini Lots and 3) Standard Lots.
A Daily Timeframe Strategy That Pulls 100-500+ Pips Per Trade
This is a daily timeframe strategy that can make hundreds of pips per trade for you without you having to spend hours staring at your computer monitor. Wake up in the morning, scan the charts on the daily timeframe, setup your trade and that’s it. After that you are free to do whatever you want to do.
Let’s discuss this Daily Timeframe Strategy. This Daily Timeframe strategy uses only two indicators. These are the Bill William’s Accelerator Oscillator (AC) and the Stochastic Oscillator. The Bill William’s Acceleration/Deceleration Indicator (AC) measures the acceleration and deceleration of the current driving force.
Perfect Order Forex Strategy
Perfect order takes places when the moving averages are stacked in a sequential order. For example, suppose you are using a three simple moving average system, 10 day SMA, 20 day SMA and 50 day SMA. In an uptrend, a perfect order world be when the 10 day SMA is above the 20 day SMA and the 20 day SMA is above the 50 day SMA. In the same manner, the 100 day SMA should be below the 50 day SMA and the 200 day SMA should be below the 100 day SMA.
The Morning Star And The Three White Soldiers Candlestick Patterns

Three stick candlestick patterns are more complicated than the single stick and two stick patterns. These patterns take three days to emerge as a valid signal. One such three stick candlestick trend reversal pattern is the Morning Star. However, a Morning Star and the Bullish Doji Star look almost the same but are in fact two different three stick candlestick patterns. You need to know how to distinguish between them.
In case of the Morning Star and the Bullish Doji Star Patterns, the first day is a large bearish candle, the second day in case of the Doji Star Pattern is a True Doji while in case of the Morning Star it is almost a Doji. The price action behind these two patterns is almost the same.
Leveraged Carry Trading Strategy
Carry trade strategy entails buying a high interest rate currency and selling a low interest rate currency. Suppose, New Zealand Dollar NZD offers an interest rate of 4.35% while the Japanese Yen JPY offers 0.35%. Carry trade strategy involves buying NZD and selling JPY. The investor earns a profit equal to the interest rate differential of 4% as long as the exchange rate between the two currencies does not change.
Carry trade is one of the fundamental trading strategies that uses the basic economic principle that money constantly keeps on flowing from a low interest market to a high interest market. Markets that offer the highest interest rate attract the most capital. Countries are no different. Countries offering a better interest rate attract more capital as compared to countries offering low interest rate.
Trading Retracements With Fibonacci Levels
In the last article, we discussed how to trade breakouts with Fib Projection Levels. Let’s discuss that breakout situation again. But this time, let’s assume it fails. Again assume that breakout scenario where EURUSD price rise from 1.2200 to 1.2300. But you are less confident that the price action will continue to rise. You still want to take the trade with one standard lot (100,000 units).
You enter the market with 1/4 lot (25,000 units) at 1.2300 just like before. If the prices continue to rise just like before, you can still profit from that move by gradually adding to the partial position to target the exit of 1.2400. Now, suppose the price doesn’t rise.
Trading Breakouts With Fibonacci Projection Levels
Most breakouts tend to fail. It is impossible to know which breakout will succeed and which breakout will fail. But you have to be in it to win it. As a trend trader, you have to take every trade. However, using Fibonacci can optimize your few wins and minimize many losses.
When you spot the breakout candle, enter the market with half of your trade size. If the price continues in your favor as you had anticipated add 1/4th of the trade size at 138.2% of the initial move. And if the momentum continues in the direction that you had wanted and anticipated, add the final 1/4th of the trade size at 162.8% of the move.
Trading Support And Resistance Using Turnabouts Strategy
When you make a mistake in trading, there are no money back guarantees that can give you back your hard earned money. Turnabout is a conservative approach to trading support and resistance. This is the closest to the money back guarantee that you can get when trading support and resistance.
Support and resistance is one of the key concepts in trading. Support is like the floor of a room. When you hit it with a ball, the ball will bounce up. In the same manner, resistance is like the ceiling of a room. When you hit it with a ball, the ball will bounce down.
ETF Trend Trading
This is an entry for a Forex product called ETF Trend Trading. The official site for this product is at etftradingcourse.com. If you’re looking for more info about this product follow the link.
Tom Strignano Money Management
This is an entry for a Forex product called Tom Strignano Money Management. The official site for this product is at tomstrignanomoneymanagement.com. If you’re looking for more info about this product follow the link.
Forex Trading Strategies
Forex trading has received a great deal of attention from those seeking quick, instant wealth. Nevertheless, without creating a strong and unique strategy to approach Forex, these individuals will be left penniless. Forex trading strategies lower potential risk in either day/swing trading for those individuals with solid determined traders who remain calm at crucial moments and stick to the strategy.
Market Analysis For Great Forex Gains
Forex trading strategies are plentiful, perhaps the exact reasons why a lot of people haven’t got a clue where to start. Nevertheless, all these strategies use two common characteristics and techniques: fundamental or technical analysis.
When you look at a fundamental analysis report, what you see is the whole financial scope including trades, historical analysis. These trends reveal international macroeconomics and influences that effect the supply and demand of currency trading. Here are five factors that influence it:
Combining Moving Averages With Candlestick Patterns
Moving averages are one of the most simplest yet the most widely used technical indicators. You will find almost every other trading system using moving averages in one form or another. Moving averages are just the average of the closing prices of a currency pair over a certain period of time.
Moving averages can be useful when you are looking to confirm a trend. The first rule of thumb when using moving averages is that when the currency pair price is above the moving average, an uptrend is in place. When you combine this with a bullish candlestick pattern you can get profitable entry and exit signals. Similarly, when price action is below the moving average, a downtrend is in place.
Combining Trendlines With Candlestick Patterns To Enter And Exit Trades
Trendline is one of the most easiest to understand technical indicators. Most of the charting software will automatically draw the trend line for you. You can use a bullish trendline and the bullish candlestick patterns to pick long entry points as well as confirm trends. In the same manner, you can use a bearish trendline in conjunction with bearish candlestick patterns for a short entry in the market.
When you combine a bullish trendline with a bullish candlestick pattern or a bearish trendline with a bearish candlestick pattern, you will get a pretty accurate signal that tells whether you should stick with a position or exit it.
Simple Forex Trading Strategy Using Elliott Wave Indicators
Elliott Waves were first discovered by R.N Elliott in the 1930s. What he found was that markets follow a certain wave pattern over the long term as well as on the short term that is repeated over and over again. This wave pattern is now considered to be a universal law of the markets and is named as Elliott Waves Principle.
Stealth Forex Signals
This is an entry for a Forex product called Stealth Forex Signals. The official site for this product is at stealthforexsignals.com. If you’re looking for more info about this product follow the link.
Forex Hybrid DS
This is an entry for a Forex product called Forex Hybrid DS. The official site for this product is at forexdualsystem.com. If you’re looking for more info about this product follow the link.
Short Term, Intermediate Term And Long Term Trendlines Are A Useful Tool For Traders
Prices trend. Trendlines are drawn by connecting two or more points of support and resistance. An uptrend means a series of price bars or candles exhibiting higher lows, higher highs or higher closes. Similarly, a downtrend means a series of price bars or candles showing lower highs, lowers lows or lower closes.
An uptrend line or support is drawn by connecting the higher lows with a straight line and extending that into the future. Similarly, a downtrend line or resistance is drawn by connecting the lower highs with a straight line and extending that into the future.
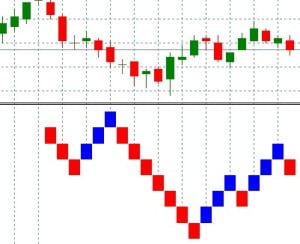
Divergence Trading Using Stochastics
One of the most popular ways to use Stochastics is divergences. A divergence takes place when the price and the stochastics diverge from following the same path. For example, if the price makes a new low but the stochastics don’t, it is a divergence. In the same way, if the stochastics make a new high and the price doesn’t, it is again a divergence.
Now, keep this in mind that divergence on a daily chart is quite different than the divergence on the weekly chart. Divergence on the daily chart means that the price will make a short term counter trend move in the next one to five days.
Stochastics For Forex Traders
Stochastics is one of the most popular indicators in forex trading. You can find it on almost all platforms and charting services. But most traders use them incorrectly. Stochastics is an oscillator that has two components %K and %D. This is the formula to calculate K=100(C-L)(H-L) where C is the Close, H High and L the Low of the period. Typically this period is 14 days. However, 9 days period is also popular. %K is the 3 day MA of K and %D is the 3 day MA of %K.
Fortunately, you don’t have to go into all this maths unless you want to fiddle with it and see if you can make it work better. One common question is how many days to use in Stochastics. Stick with 14 days as it is the default. Longer period means lesser signals and lower whipsaw while shorter periods means more signals and more whipsaw.
A Channel Breakout Trading Strategy
A Channel is formed when we draw a trendline and then a line parallel to the trendline with most of the price action if not all falling between the two lines. By scanning through a few charts, you will find that it is easy to identify channels. Channels occur frequently.
However, currencies rarely stay in a narrow range for long and have a tendency to breakout from a tight range and develop a strong trend in the market. Important economic news releases can act as a trigger for a breakout.
A Simple Scalping Strategy Called Lucky Spike

Many traders use scalping as their main trading strategy. Scalping means quickly entering and exiting the market making a few pips every time. Most scalpers look for making a quick 10-20 pips each time they enter and exit the market. By making a few high probability scalping trades every day, you can make 30-60 pips easily.
There are many scalping strategies. This simple scalping strategy is known as the Lucky Spike and it is being used by many traders to make consistent profits each and every day scalping the forex market.
Ultimate Swing Trader
This is an entry for Ultimate Swing Trader: (official website: ultimateswingtrader.com) Please leave your comments or reviews below. If you …
FX Loophole
This is an entry for FX Loophole: (official website: fxloophole.com) Please leave your comments or reviews below. If you want …
Forex Binary Options Strategy That Can Hedge Your Spot Positions
You can bet on the direction of the currency market with the help of forex binary options. Forex Binary Options also known as Exotics give you a fixed payoff of $100 if the market is above or below a certain price level when the binary options contract expires. And in case the market does not cooperate, you get $0 as a payoff. You can trade forex binary options on currency pairs like EURUSD, USDCAD, GBPUSD, USDJPY with intraday, daily and weekly expirations.
Daily, Weekly And Monthly Pivot Points – The Importance of Confluence
You must have often heard market analysts talking about the daily, weekly and monthly support and resistance levels. How do these analysts calculate these daily, weekly and monthly support and resistance levels? Most are using Daily, Weekly, and Monthly Pivot Point numbers!
Difference between a winning trader and a losing trader is what they do with the price data they have. Pivot Point can give you the edge as they are considered to be a leading indicator unlike most other technical indicators that are lagging in nature. Read the first article on Pivot Point Analysis before you continue with this one.
Pivot Point Analysis – A Powerful Tool

Pivot Point Analysis is a robust and time tested method of market analysis. This strategy works in all markets that have an established range. The range is the high and low of a given time period and it accurately depicts the market participants exuberant bullishness and pessimistic bearishness for a given trading session.
The high and low are the two most important reference points for a given trading session. The high is a reference point for those who bought out of greed thinking that they were missing an opportunity. Similarly, the low depicts selling out of fear thinking that they would lose by staying in the long trade.
Commodities Channel Index Breakout Strategy
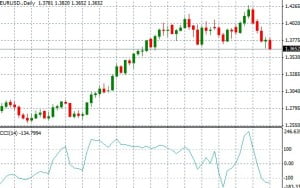
Commodities Channel Index (CCI) is an oscillator that measures the strength of the current market cycle and attempts to predict when it will end. CCI indicator default measurements are +100 to -100. When the indicator is above +100, the market is considered to be overbought and when it is below -100, the market is considered to be oversold.
Commodities Channel Index breakouts occur when it falls below +100 or rises above -100. Most traders are taught to buy when the breakout from the oversold market takes place and sell when the breakout from the overbought market condition takes place. In this CCI Breakout Trading Strategy, we will be using a variation of this by combining the Commodities Channel Index Breakouts with our usual support and resistance on the Daily Charts.
200 EMA Forex Strategy For Beginners Called Bucking The Trend
 The challenge for many new forex traders is to identify the overall trend on the intraday charts. The 200 Exponential Moving Average (EMA) can solve the problem for them. 200 EMA is one of the most popular technical analysis indicators amongst forex traders.
In order to use the 200 EMA Forex Strategy open the 4 hour, 1 hour and the 15 minute charts on your MT4 Platform. Plot the 200 EMA on these 3 charts and color it red.
Tile the three charts in a vertical fashion so that you can view the three charts one above the other. Now, scroll through the various currency pairs like the EUR/USD, GBP/USD, USD/CHF, USD/JPY, USD/CAD, EUR/JPY, AUD/USD, NZD/USD, EUR/CHF or whatever pair you like to trade.
Forex Innovator
This is an entry for Forex Innovator: (official website: forexinnovator.com) Please leave your comments or reviews below. If you want …
Doji Candlestick Patterns
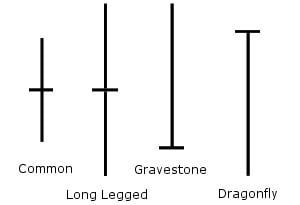
There are certain Candlestick Patterns that are vital to your trading. They are vital because they identify possible trend reversals. Why should you identify these candlestick patterns? Because they can make you money! Failure to spot these candlestick patterns can lead to costly trading mistakes.
Ask any trader who uses candlesticks in trading, which of all the candlestick patterns is the most important to recognize. He or she will unhesitatingly say a Doji. Appearance of a Doji Candlestick Pattern is often a signal for the beginning of a minor or an intermediate trend.
Momentum Forex Trading Strategy for Traders Lacking Patience

Many new forex traders lack the patience to wait days for a trade to develop. These types of traders want the trade to turn into a profit within minutes of entering into the trade. If it doesn’t, they usually abandon the trade as they lack the patience to follow it through. These type of traders are more than happy to make 10 pips multiple times a day instead of making something like 100-200 pips in a trade with the potential of the trade going against them in the beginning.
For these type of traders momentum trading is the best forex trading strategy. The aim of this short term momentum forex trading strategy is to hit the profit target as early as possible. This is achieved by entering the market long or short when the momentum is on your side.
Forex Morning Trade
This is an entry for Forex Morning Trade: (official website: http://www.forexmorningtrade.com/) Please leave your comments or reviews below. If you …
Renko Charts – Never Let Your Profit Turn Into A Loss
Never let your profit turn into a loss. In forex trading, a few seconds might be enough for the market to move into the negative territory and wipe out all of the pips gained by you. As a trader, your number one focus after entering into a trade is to determine when to get out. If the position is losing money, you can use the traditional stop loss strategies.
However, suppose your trade is profitable. Seeing profits emerge in your trade is exciting. But the technical challenge is to recognize when to exit a profitable position before your profit turns into a loss. These challenges are real as many traders are unable to get out in time and protect their profit.
Breakout Trading Forex Strategy – Filtering False Breakouts

Breakout trading can be highly profitable yet at the same time frustrating as many breakouts have a tendency to fail. The main cause behind most of these false breakouts in the forex market is the big players that intentionally cause pairs to breakout in order to suck in non suspecting or inexperienced players.
Breakout trading is all about learning how to avoid trading a false breakout. You need to develop a price filter that can help you screen a false breakout from a true breakout so that you can trade it.
Forex Cash Bot
 Forex Cash Bot is a new Forex robot that promises to work. But don’t they all?
Forex Fortune Teller
This is an entry for Forex Fortune Teller. Please leave your comments or reviews below. If you want to submit …
The Forex Millionaires
This is an entry for The Forex Millionaires. Please leave your comments or reviews below. If you want to submit …
Forex Geyser
This is an entry for Forex Geyser. Please leave your comments or reviews below. If you want to submit a …
Forex-U-Turn
 Forex-U-Turn is a manual Forex trend trading system by Jason Sweezey (his last product was 4X Pip Snager).
Method 311
 Method 311 is a manual Forex trading system by Donna Forex.