There are certain Candlestick Patterns that are vital to your trading. They are vital because they identify possible trend reversals. Why should you identify these candlestick patterns? Because they can make you money! Failure to spot these candlestick patterns can lead to costly trading mistakes.
Ask any trader who uses candlesticks in trading, which of all the candlestick patterns is the most important to recognize. He or she will unhesitatingly say a Doji. Appearance of a Doji Candlestick Pattern is often a signal for the beginning of a minor or an intermediate trend.
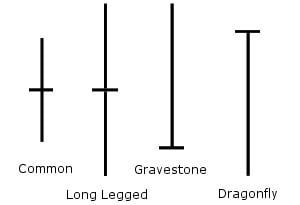
Failure to recognize the Doji on the candlestick chart runs the risk of buying at the top or staying far too late in the trend. Whatever, you should be immediately able to recognize these four Doji Candlestick Patterns, The Common Doji, The Long Legged Doji, Dragonfly Doji and the Gravestone Doji.
One thing common between these four Doji Patterns is the fact that the prices opened and closed at the same level. If the prices opened and closed very close forming a very small body, even then you can still recognize it as a Doji Pattern.
After a long uptrend, the appearance of a Doji on the candlestick chart is a signal that trend is about to reach its top. In an uptrend, bulls have been winning the previous battles as the prices had moved higher. The appearance of a Doji signals that neither the bulls nor the bears had won. This means equilibrium in the market between the sellers and the buyers or a tug of war that neither the bulls nor the bears are winning.
Similar is the case in a long downtrend. The bears had been winning the battles but the appearance of the Doji means that the bulls have found the courage to win and the tide may soon turn in favor of the bulls in the market.
A Common Doji Pattern represents indecision in the market. A Long Legged Doji is a far more dramatic pattern. It means that the prices had moved higher in the day then selling kicked in leaving a long upper shadow on the candle. A close before the midpoint of the candle indicates a lot of weakness.
When a Long Legged Doji Pattern is formed outside the Upper Bollinger Band after a long uptrend, it means a possible trend reversal. If it is confirmed by the sell signal on the stochastics, it is a reliable warning that a reversal is about to happen soon.
A Gravestone Doji indicates that prices had rallied higher on the day but buying could not be sustained in the market and the prices came back and closed at the open. A Dragonfly Doji is the exact opposite of the Gravestone Doji. Prices opened at the high then selling kicked in the market later on buyers found the courage to start buying and the prices came back to close at the open.
Now, you need to assess the appearance of a Doji by carefully noting when the Doji occurred on the candlestick chart. Appearance of a Doji in the early stages of a trend may mean nothing. Similarly, if you find the Doji appearing in the middle of a Bollinger Band, it may mean a pause rather a reversal of a trend.