Importance of Timeframe Coordination in Forex Trading

Trading Strategy

Using the higher timeframe to confirm a trading signal on a lower timeframe is a skill that can be highly rewarding for a trader. Many traders take a trade that is coordinated on the lower timeframe but not the higher timeframe which often gives them bad trades and a waste of time and energy.

Suppose, you find the trend on the intraday chart and the trend on the daily chart in the same direction, it is like having the wind at your back.If you can master the art of identifying currency pairs that have the intraday trends in the same direction as the daily and the weekly trends, you can reap immense rewards.
Read more

Breakout Trading Entry, Exit and Stop Loss Strategies

Trading Strategy

Breakout trading can be highly profitable. But the problem is most breakouts tend to fail often. A breakout fails when the price returns to a point before the breakout. Suppose the price breaks out above the resistance line but soon retraces back below the resistance line. This means the breakout was false. But in many cases, prices retraces itself slightly above or below an important breakout level before continuing in the direction of the breakout.

Read more

Divergence Trading With MACD Histogram

Trading Strategy

Divergences are considered to be pretty strong trend reversal signals. Divergence happens when the price action and the indicator in this case the histogram moves in the opposite directions. For example, the price action makes a new high while the indicator makes a new low or the price action makes a new low while the indicator makes a new high.

When divergence between the price action and the indicator develops, it means a potential trend reversal in the market. MACD is a very versatile technical indicator that can be used to trade these divergence patterns.

Read more

How To Trade With The MACD Histogram

Trading Strategy

A MACD Histogram is a bar chart. The slope of the MACD Histogram is very important. This is the best indicator that tells whether bears or bulls are controlling the market. An upward slopping histogram indicates that the bulls are getting stronger while a downward sloping histogram indicates that the bears are getting stronger.

The price trend whether up or down is likely to continue if it is in the same direction as the slope of the MACD Histogram. When the slope of the histogram and the price action are moving in opposite direction, it means that the trend is in jeopardy. As a rule, always try to trade in the direction of the slope of the histogram.

Read more

How to Be a Top Forex Trader

Trading Strategy

In the Forex market, everyone wants to become the infamous powerhouse broker with an unending stream of money coming out of their pockets. The reality is, according to Forex brokers, 90% of traders fail terribly because they just do not know what they are doing, how things work, or that they aren’t prepared enough. The other 10 percent, well, consider that only 5% comes even while the other 5% experiences repeated success. How do they do it? In this post, I’ll explain five key principles required to become a power trader:

Read more

Fibonacci and Online FX Trading

Trading Strategy

Fibonacci and Online FX Trading offers the capacity not only to react promptly to market change but to react using an online platform which has the necessary strategic resources. The Fibonacci pattern is a well regarded mathematical sequence and can be applied to the forex way of thinking.

The foreign exchange market, aptly known as forex is the biggest financial market in the world and as a result the sheer level of variables, opens a vast array of possibility regarding technical analysis and trading patterns.

Read more

Trend Trading With Bollinger Bands

Trading Strategy

Do you know this fact that the Bollinger Bands can be used as a very effective tool for detecting and trading trends even though most of us have only be taught to use them in a range bound market. Here is how to capture the trend with Bollinger Bands (BBs). Bollinger bands are used to measure the deviation or what we call volatility in the market. Bollinger bands measure the standard deviation of price action away from its 20 period moving average.

Read more

A Daily Timeframe Strategy That Pulls 100-500+ Pips Per Trade

Trading Strategy

This is a daily timeframe strategy that can make hundreds of pips per trade for you without you having to spend hours staring at your computer monitor. Wake up in the morning, scan the charts on the daily timeframe, setup your trade and that’s it. After that you are free to do whatever you want to do.

Let’s discuss this Daily Timeframe Strategy. This Daily Timeframe strategy uses only two indicators. These are the Bill William’s Accelerator Oscillator (AC) and the Stochastic Oscillator. The Bill William’s Acceleration/Deceleration Indicator (AC) measures the acceleration and deceleration of the current driving force.

Read more

The Morning Star And The Three White Soldiers Candlestick Patterns

Morning Star

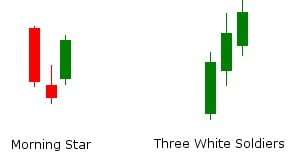
Three stick candlestick patterns are more complicated than the single stick and two stick patterns. These patterns take three days to emerge as a valid signal. One such three stick candlestick trend reversal pattern is the Morning Star. However, a Morning Star and the Bullish Doji Star look almost the same but are in fact two different three stick candlestick patterns. You need to know how to distinguish between them.

In case of the Morning Star and the Bullish Doji Star Patterns, the first day is a large bearish candle, the second day in case of the Doji Star Pattern is a True Doji while in case of the Morning Star it is almost a Doji. The price action behind these two patterns is almost the same.

Read more

Leveraged Carry Trading Strategy

Trading Strategy

Carry trade strategy entails buying a high interest rate currency and selling a low interest rate currency. Suppose, New Zealand Dollar NZD offers an interest rate of 4.35% while the Japanese Yen JPY offers 0.35%. Carry trade strategy involves buying NZD and selling JPY. The investor earns a profit equal to the interest rate differential of 4% as long as the exchange rate between the two currencies does not change.

Carry trade is one of the fundamental trading strategies that uses the basic economic principle that money constantly keeps on flowing from a low interest market to a high interest market. Markets that offer the highest interest rate attract the most capital. Countries are no different. Countries offering a better interest rate attract more capital as compared to countries offering low interest rate.

Read more

Trading Retracements With Fibonacci Levels

Trading Strategy

In the last article, we discussed how to trade breakouts with Fib Projection Levels. Let’s discuss that breakout situation again. But this time, let’s assume it fails. Again assume that breakout scenario where EURUSD price rise from 1.2200 to 1.2300. But you are less confident that the price action will continue to rise. You still want to take the trade with one standard lot (100,000 units).

You enter the market with 1/4 lot (25,000 units) at 1.2300 just like before. If the prices continue to rise just like before, you can still profit from that move by gradually adding to the partial position to target the exit of 1.2400. Now, suppose the price doesn’t rise.

Read more

Trading Breakouts With Fibonacci Projection Levels

Trading Strategy

Most breakouts tend to fail. It is impossible to know which breakout will succeed and which breakout will fail. But you have to be in it to win it. As a trend trader, you have to take every trade. However, using Fibonacci can optimize your few wins and minimize many losses.

When you spot the breakout candle, enter the market with half of your trade size. If the price continues in your favor as you had anticipated add 1/4th of the trade size at 138.2% of the initial move. And if the momentum continues in the direction that you had wanted and anticipated, add the final 1/4th of the trade size at 162.8% of the move.

Read more

Trading Support And Resistance Using Turnabouts Strategy

Trading Strategy

When you make a mistake in trading, there are no money back guarantees that can give you back your hard earned money. Turnabout is a conservative approach to trading support and resistance. This is the closest to the money back guarantee that you can get when trading support and resistance.

Support and resistance is one of the key concepts in trading. Support is like the floor of a room. When you hit it with a ball, the ball will bounce up. In the same manner, resistance is like the ceiling of a room. When you hit it with a ball, the ball will bounce down.

Read more

Harami – An Important Trend Reversal Candlestick Pattern

Harami Pattern

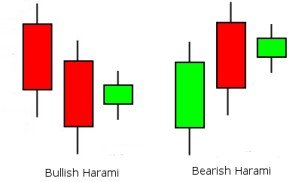
Harami is an important trend reversal pattern. It is a two day candlestick pattern with the candle of the setup day longer than the candle of the signal day. Harami is the Japanese word for pregnant. If you draw this a pattern, it will look like a pregnant woman. The pattern can be bullish as well as bearish.

In case of the bullish harami, the first day is a bearish candle that occurs in a downtrend. On the second day, bulls enter the market and start moving the prices higher but not with much success as the price close lower than the open of the first day and the first day’s high is not surpassed. However, when this pattern appears it culminates in a trend reversal.

Read more

How To Choose The Right Forex Broker

Trading Strategy

Before you jump into Forex trading, consider what the environment you’re getting into. Forex is considered a risky investment, so approach with caution. As we all know, every investment won’t return the profit we sought, and similarly, every potential investor may not have what it takes to be a Forex trader. If you’re approaching these feelings of uncertainty, I recommend speaking with a Forex broker.

Read more

A Successful Start to Forex Trading

Candlestick Chart

In order to start a home business, one must fully analyze their current financial wit and their capabilities. Investment must come with a strong emotional security because it’s important for you to fully understand that your investments come at a high price, there’s always the risk of total failure. Nevertheless, you mustn’t gamble your money away, you’ve got to be prepared, diligent, smart, and very determined.

Read more

Forex Trading Strategies

Trading Strategy

Forex trading has received a great deal of attention from those seeking quick, instant wealth. Nevertheless, without creating a strong and unique strategy to approach Forex, these individuals will be left penniless. Forex trading strategies lower potential risk in either day/swing trading for those individuals with solid determined traders who remain calm at crucial moments and stick to the strategy.

Read more

Market Analysis For Great Forex Gains

Trading Strategy

Forex trading strategies are plentiful, perhaps the exact reasons why a lot of people haven’t got a clue where to start. Nevertheless, all these strategies use two common characteristics and techniques: fundamental or technical analysis.

When you look at a fundamental analysis report, what you see is the whole financial scope including trades, historical analysis. These trends reveal international macroeconomics and influences that effect the supply and demand of currency trading. Here are five factors that influence it:

Read more

Trading Price Oscillator Divergences Can Increase Your Chances Of Making Winning Trades

Trading Strategy

Trading divergence patterns is not a complete trading strategy rather it is an additional tool in the technical trading toolkit of any trader. Divergence is simply the disagreement between the price action and the indicator movement.

Now any oscillator can be used to show divergence patterns. The most commonly used oscillators include RSI, Stochastics, MACD, CCI, ROC and Williams %R. However, any oscillator can show divergence with price action.

Read more

Combining Moving Averages With Candlestick Patterns

Trading Strategy

Moving averages are one of the most simplest yet the most widely used technical indicators. You will find almost every other trading system using moving averages in one form or another. Moving averages are just the average of the closing prices of a currency pair over a certain period of time.

Moving averages can be useful when you are looking to confirm a trend. The first rule of thumb when using moving averages is that when the currency pair price is above the moving average, an uptrend is in place. When you combine this with a bullish candlestick pattern you can get profitable entry and exit signals. Similarly, when price action is below the moving average, a downtrend is in place.

Read more

Combining Trendlines With Candlestick Patterns To Enter And Exit Trades

Candlestick Chart

Trendline is one of the most easiest to understand technical indicators. Most of the charting software will automatically draw the trend line for you. You can use a bullish trendline and the bullish candlestick patterns to pick long entry points as well as confirm trends. In the same manner, you can use a bearish trendline in conjunction with bearish candlestick patterns for a short entry in the market.

When you combine a bullish trendline with a bullish candlestick pattern or a bearish trendline with a bearish candlestick pattern, you will get a pretty accurate signal that tells whether you should stick with a position or exit it.

Read more

Simple Forex Trading Strategy Using Elliott Wave Indicators

Trading Strategy

Elliott Waves were first discovered by R.N Elliott in the 1930s. What he found was that markets follow a certain wave pattern over the long term as well as on the short term that is repeated over and over again. This wave pattern is now considered to be a universal law of the markets and is named as Elliott Waves Principle.

Read more

Practice Trading Make Easy

Trading Strategy

Money does not grow on trees. That is why most of the people are hesitant to invest their money in Foreign Exchanges in fear of losing it. If you jump into investing your money on a business you are not familiar with, tendencies are you may fail miserably and lose all of your investments. You don’t want that to happen. Practice trading is your number one step.

Read more

Moving Average Convergence Divergence (MACD) Is A Simple Yet Reliable Forex Indicator

Trading Strategy

The Moving Average Convergence/Divergence (MACD) is a versatile indicator. Moving Average Convergence/Divergence is one of the simplest and most reliable forex indicators. MACD will help you identify both the bull divergence as well the bear divergence which are rare but effective patterns.

This is a hybrid tool that is helpful in determining the present market direction as well as measure the price momentum. Many traders use MACD as their sole confirming indicator. This multi faceted indicator acts as a sign of the trend momentum by representing the relationship between the two moving averages.

Read more

Powerful New Forex Strategy

Trading Strategy

Forex Binary Options can deliver massive 1,328% gains! Forex Binary Options is a tool that 99% of the investing public hasn’t heard about yet. Forex Binary Options are a brand new currency trading tool that is cheap, easy and powerful. In simple terms, Binary Options are like a bet whether something will happen or not. It is just like a Yes or No investment.

For example, you can bet on whether EUR/USD rate will fall below 1.3570 or whether AUD/USD rate will rise above 1.0000. Now, if your bet comes out right and EUR/USD rate does fall below 1.3570 or AUD/USD does rise above 1.0000, you collect your original investment plus a profit. If not, you lose the original investment that you had made in the trade.

Read more

Short Term, Intermediate Term And Long Term Trendlines Are A Useful Tool For Traders

Trading Strategy

Prices trend. Trendlines are drawn by connecting two or more points of support and resistance. An uptrend means a series of price bars or candles exhibiting higher lows, higher highs or higher closes. Similarly, a downtrend means a series of price bars or candles showing lower highs, lowers lows or lower closes.

An uptrend line or support is drawn by connecting the higher lows with a straight line and extending that into the future. Similarly, a downtrend line or resistance is drawn by connecting the lower highs with a straight line and extending that into the future.

Read more

Divergence Trading Using Stochastics

Trading Strategy

One of the most popular ways to use Stochastics is divergences. A divergence takes place when the price and the stochastics diverge from following the same path. For example, if the price makes a new low but the stochastics don’t, it is a divergence. In the same way, if the stochastics make a new high and the price doesn’t, it is again a divergence.

Now, keep this in mind that divergence on a daily chart is quite different than the divergence on the weekly chart. Divergence on the daily chart means that the price will make a short term counter trend move in the next one to five days.

Read more

Stochastics For Forex Traders

Stochastics

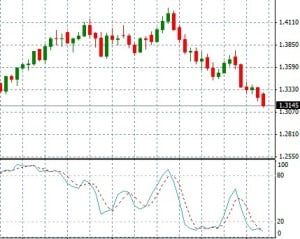
Stochastics is one of the most popular indicators in forex trading. You can find it on almost all platforms and charting services. But most traders use them incorrectly. Stochastics is an oscillator that has two components %K and %D. This is the formula to calculate K=100(C-L)(H-L) where C is the Close, H High and L the Low of the period. Typically this period is 14 days. However, 9 days period is also popular. %K is the 3 day MA of K and %D is the 3 day MA of %K.

Fortunately, you don’t have to go into all this maths unless you want to fiddle with it and see if you can make it work better. One common question is how many days to use in Stochastics. Stick with 14 days as it is the default. Longer period means lesser signals and lower whipsaw while shorter periods means more signals and more whipsaw.

Read more

A Channel Breakout Trading Strategy

Trading Strategy

A Channel is formed when we draw a trendline and then a line parallel to the trendline with most of the price action if not all falling between the two lines. By scanning through a few charts, you will find that it is easy to identify channels. Channels occur frequently.

However, currencies rarely stay in a narrow range for long and have a tendency to breakout from a tight range and develop a strong trend in the market. Important economic news releases can act as a trigger for a breakout.

Read more

A Simple Scalping Strategy Called Lucky Spike

Trading Strategy

Many traders use scalping as their main trading strategy. Scalping means quickly entering and exiting the market making a few pips every time. Most scalpers look for making a quick 10-20 pips each time they enter and exit the market. By making a few high probability scalping trades every day, you can make 30-60 pips easily.

There are many scalping strategies. This simple scalping strategy is known as the Lucky Spike and it is being used by many traders to make consistent profits each and every day scalping the forex market.

Read more

Ultimate Forex Club

This is an entry for Ultimate Forex Club: (official website: ultimateforexclub.com) Please leave your comments or reviews below. If you …

Read more

Ultimate Swing Trader

This is an entry for Ultimate Swing Trader: (official website: ultimateswingtrader.com) Please leave your comments or reviews below. If you …

Read more

Bullish and Bearish Engulfing Candlestick Patterns Warn Of A Trend Reversal

Engulfing Pattern

Many traders make a good living catching changes in the trend. Catching a trend change means trying to pick the top or bottom of a trending move. It is not easy but it can be highly rewarding if done correctly. Bullish and bearish Engulfing Candlestick Pattern is one of the most popular patterns used by these type of traders to anticipate a trend reversal.

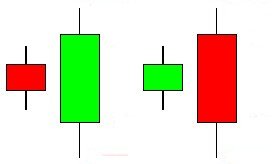
This is a two stick pattern meaning it takes two days for the pattern to develop. The pattern’s name comes from the fact that the signal day completely engulfs the setup day. So the candle body and the wick on the signal day engulfs the candle body and wick on the setup day.

Read more

FX Loophole

This is an entry for FX Loophole: (official website: fxloophole.com) Please leave your comments or reviews below. If you want …

Read more

Commodities Channel Index Breakout Strategy

CCI

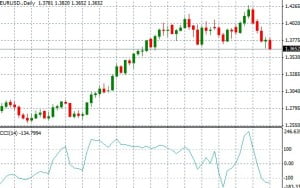
Commodities Channel Index (CCI) is an oscillator that measures the strength of the current market cycle and attempts to predict when it will end. CCI indicator default measurements are +100 to -100. When the indicator is above +100, the market is considered to be overbought and when it is below -100, the market is considered to be oversold.

Commodities Channel Index breakouts occur when it falls below +100 or rises above -100. Most traders are taught to buy when the breakout from the oversold market takes place and sell when the breakout from the overbought market condition takes place. In this CCI Breakout Trading Strategy, we will be using a variation of this by combining the Commodities Channel Index Breakouts with our usual support and resistance on the Daily Charts.

Read more

200 EMA Forex Strategy For Beginners Called Bucking The Trend

Illustration: Trading StrategyThe challenge for many new forex traders is to identify the overall trend on the intraday charts. The 200 Exponential Moving Average (EMA) can solve the problem for them. 200 EMA is one of the most popular technical analysis indicators amongst forex traders.
In order to use the 200 EMA Forex Strategy open the 4 hour, 1 hour and the 15 minute charts on your MT4 Platform. Plot the 200 EMA on these 3 charts and color it red.

Tile the three charts in a vertical fashion so that you can view the three charts one above the other. Now, scroll through the various currency pairs like the EUR/USD, GBP/USD, USD/CHF, USD/JPY, USD/CAD, EUR/JPY, AUD/USD, NZD/USD, EUR/CHF or whatever pair you like to trade.

Read more

Forex Innovator

This is an entry for Forex Innovator: (official website: forexinnovator.com) Please leave your comments or reviews below. If you want …

Read more

Momentum Forex Trading Strategy for Traders Lacking Patience

Illustration: Trading Strategy

Many new forex traders lack the patience to wait days for a trade to develop. These types of traders want the trade to turn into a profit within minutes of entering into the trade. If it doesn’t, they usually abandon the trade as they lack the patience to follow it through. These type of traders are more than happy to make 10 pips multiple times a day instead of making something like 100-200 pips in a trade with the potential of the trade going against them in the beginning.

For these type of traders momentum trading is the best forex trading strategy. The aim of this short term momentum forex trading strategy is to hit the profit target as early as possible. This is achieved by entering the market long or short when the momentum is on your side.

Read more

Ichimoku Kinko Hyo – A Unique Trend Trading Indicator

Illustration: Ichimoku Kinko Hyo

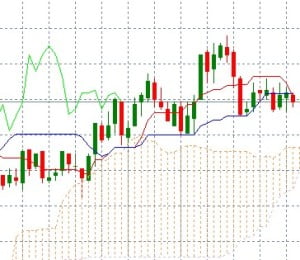
Ichimoku Kinko Hyo is a unique trend trading charting system. You will find this Ichimoku Kinko Hyo Indicator to be one of the most versatile and effective trend trading indicators. In fact, it is a full trend trading charting system that you can easily master. It won’t take much of your time and effort. The name may sound intimidating to those unfamiliar with Japanese and a quick glance at the formula makes it appear far more complex than it really is. Despite its intimidating appearance, this is a very simple system.

Ichimoku Kinko Hyo Indicator is surprisingly not a well known indicator. The primary strength of the Ichimoku Kinko Hyo System is that it uses multiple data points to give the trader a deeper and comprehensive picture of the price action. Ichimoku is a very visual system that helps the trader to quickly discern and filter the low probability trade setups from the high probability trade setups.

Read more

Copy Live Trades

This is an entry for Copy Live Trades: (official website: copylivetrades.com) Please leave your comments or reviews below. If you …

Read more

Forex Morning Trade

This is an entry for Forex Morning Trade: (official website: http://www.forexmorningtrade.com/) Please leave your comments or reviews below. If you …

Read more

Forex Geyser

This is an entry for Forex Geyser. Please leave your comments or reviews below. If you want to submit a …

Read more

Forex Profit Multiplier

Forex Profit MultiplierForex Profit Multiplier is a Forex trading education and training course by Profits Run. According to the company, it’s a compilation of what their clients have been asking for the past 10 years and it’s the beset course Profits Run has released to date.

Read more