The Hammer and the Hangman Candlestick Patterns are Important Reversal Signals

Illustration: Currency

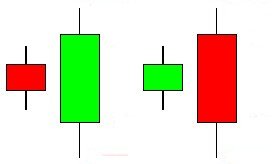
The hammer, the hangman and the doji are some of the few most important candlestick patterns that every trader should recognize. Both the hammer and the hangman have a small real body and a long lower shadow with almost no upper shadow. To be a hammer or a hangman, the shadow should be at least two times the body (the longer the shadow the more significant the pattern). However, it is very easy to confuse hammer with the hangman.

Read more

Combining Doji Candlestick Patterns with Bollinger Bands and Stochastic

Illustration: Forex Chart

Doji is considered to be one of the most important candlestick patterns. Appearance of a Doji signals the beginning of a minor or an intermediate trend reversal. Failing to recognize the Doji pattern, means you run the risk of buying at the top or staying far too long in a trade. As a trader, you must be able to immediately recognize the four different type of Dojis. The four type of Dojis are:

Read more

Divergence Trading With MACD Histogram

Trading Strategy

Divergences are considered to be pretty strong trend reversal signals. Divergence happens when the price action and the indicator in this case the histogram moves in the opposite directions. For example, the price action makes a new high while the indicator makes a new low or the price action makes a new low while the indicator makes a new high.

When divergence between the price action and the indicator develops, it means a potential trend reversal in the market. MACD is a very versatile technical indicator that can be used to trade these divergence patterns.

Read more

How To Trade With The MACD Histogram

Trading Strategy

A MACD Histogram is a bar chart. The slope of the MACD Histogram is very important. This is the best indicator that tells whether bears or bulls are controlling the market. An upward slopping histogram indicates that the bulls are getting stronger while a downward sloping histogram indicates that the bears are getting stronger.

The price trend whether up or down is likely to continue if it is in the same direction as the slope of the MACD Histogram. When the slope of the histogram and the price action are moving in opposite direction, it means that the trend is in jeopardy. As a rule, always try to trade in the direction of the slope of the histogram.

Read more

Fibonacci and Online FX Trading

Trading Strategy

Fibonacci and Online FX Trading offers the capacity not only to react promptly to market change but to react using an online platform which has the necessary strategic resources. The Fibonacci pattern is a well regarded mathematical sequence and can be applied to the forex way of thinking.

The foreign exchange market, aptly known as forex is the biggest financial market in the world and as a result the sheer level of variables, opens a vast array of possibility regarding technical analysis and trading patterns.

Read more

Trend Trading With Bollinger Bands

Trading Strategy

Do you know this fact that the Bollinger Bands can be used as a very effective tool for detecting and trading trends even though most of us have only be taught to use them in a range bound market. Here is how to capture the trend with Bollinger Bands (BBs). Bollinger bands are used to measure the deviation or what we call volatility in the market. Bollinger bands measure the standard deviation of price action away from its 20 period moving average.

Read more

A Daily Timeframe Strategy That Pulls 100-500+ Pips Per Trade

Trading Strategy

This is a daily timeframe strategy that can make hundreds of pips per trade for you without you having to spend hours staring at your computer monitor. Wake up in the morning, scan the charts on the daily timeframe, setup your trade and that’s it. After that you are free to do whatever you want to do.

Let’s discuss this Daily Timeframe Strategy. This Daily Timeframe strategy uses only two indicators. These are the Bill William’s Accelerator Oscillator (AC) and the Stochastic Oscillator. The Bill William’s Acceleration/Deceleration Indicator (AC) measures the acceleration and deceleration of the current driving force.

Read more

Perfect Order Forex Strategy

Trading Strategy

Perfect order takes places when the moving averages are stacked in a sequential order. For example, suppose you are using a three simple moving average system, 10 day SMA, 20 day SMA and 50 day SMA. In an uptrend, a perfect order world be when the 10 day SMA is above the 20 day SMA and the 20 day SMA is above the 50 day SMA. In the same manner, the 100 day SMA should be below the 50 day SMA and the 200 day SMA should be below the 100 day SMA.

Read more

Combining Moving Averages With Candlestick Patterns

Trading Strategy

Moving averages are one of the most simplest yet the most widely used technical indicators. You will find almost every other trading system using moving averages in one form or another. Moving averages are just the average of the closing prices of a currency pair over a certain period of time.

Moving averages can be useful when you are looking to confirm a trend. The first rule of thumb when using moving averages is that when the currency pair price is above the moving average, an uptrend is in place. When you combine this with a bullish candlestick pattern you can get profitable entry and exit signals. Similarly, when price action is below the moving average, a downtrend is in place.

Read more

Simple Forex Trading Strategy Using Elliott Wave Indicators

Trading Strategy

Elliott Waves were first discovered by R.N Elliott in the 1930s. What he found was that markets follow a certain wave pattern over the long term as well as on the short term that is repeated over and over again. This wave pattern is now considered to be a universal law of the markets and is named as Elliott Waves Principle.

Read more

Bullish and Bearish Engulfing Candlestick Patterns Warn Of A Trend Reversal

Engulfing Pattern

Many traders make a good living catching changes in the trend. Catching a trend change means trying to pick the top or bottom of a trending move. It is not easy but it can be highly rewarding if done correctly. Bullish and bearish Engulfing Candlestick Pattern is one of the most popular patterns used by these type of traders to anticipate a trend reversal.

This is a two stick pattern meaning it takes two days for the pattern to develop. The pattern’s name comes from the fact that the signal day completely engulfs the setup day. So the candle body and the wick on the signal day engulfs the candle body and wick on the setup day.

Read more

200 EMA Forex Strategy For Beginners Called Bucking The Trend

Illustration: Trading StrategyThe challenge for many new forex traders is to identify the overall trend on the intraday charts. The 200 Exponential Moving Average (EMA) can solve the problem for them. 200 EMA is one of the most popular technical analysis indicators amongst forex traders.

In order to use the 200 EMA Forex Strategy open the 4 hour, 1 hour and the 15 minute charts on your MT4 Platform. Plot the 200 EMA on these 3 charts and color it red.

Tile the three charts in a vertical fashion so that you can view the three charts one above the other. Now, scroll through the various currency pairs like the EUR/USD, GBP/USD, USD/CHF, USD/JPY, USD/CAD, EUR/JPY, AUD/USD, NZD/USD, EUR/CHF or whatever pair you like to trade.

Read more