Doji is considered to be one of the most important candlestick patterns. Appearance of a Doji signals the beginning of a minor or an intermediate trend reversal. Failing to recognize the Doji pattern, means you run the risk of buying at the top or staying far too long in a trade. As a trader, you must be able to immediately recognize the four different type of Dojis. The four type of Dojis are:
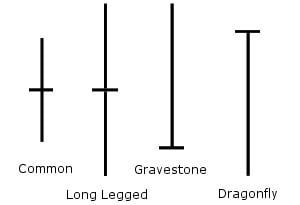
- Common
- Long Legged
- Gravestone
- Dragonfly
All these four different Dojis have one common characteristic. Prices opened and closed at the same level. If the prices opened and closed very close to each other at almost the same level, the candle will be interpreted as a Doji as it has a very small body. A common doji has a small range. A long legged doji will have a large upper and short lower shadow meaning the prices had moved far higher but then selling kicked in and the price moved back to where it had opened in the morning.
When a long legged doji appears outside the upper Bollinger Band, it should be taken as a strong signal that price action has a strong possibility of reversing. You can further confirm it with a stochastic oversold reading.
On the other hand, a gravestone doji has an upper shadow and no lower shadow meaning prices moved high during the day but then selling kicked in and prices came down to where the market had opened in the morning. In the same manner, a dragonfly doji has a lower shadow and no upper shadow meaning prices went down during the day but then the buyers stepped in and the prices climbed back to where the market had opened in the morning. Both the gravestone and the dragonfly doji patterns are not frequent.
It is very important to assess where the doji appears. If the doji appears in the middle of the Bollinger Bands, it means a weak signal and most likely the market will take a pause and not reverse itself. The doji should appear outside the Bollinger Bands to be significant.
You must also confirm the overbought and oversold readings on the Stochastic or the CCI indicator. When the appearance of a doji is confirmed by the overbought or oversold readings on the Stochastic or the CCI, it should be taken as a strong signal that the market is reversing.