Trend Trading With Bollinger Bands

Trading Strategy

Do you know this fact that the Bollinger Bands can be used as a very effective tool for detecting and trading trends even though most of us have only be taught to use them in a range bound market. Here is how to capture the trend with Bollinger Bands (BBs). Bollinger bands are used to measure the deviation or what we call volatility in the market. Bollinger bands measure the standard deviation of price action away from its 20 period moving average.

Read more

Perfect Order Forex Strategy

Trading Strategy

Perfect order takes places when the moving averages are stacked in a sequential order. For example, suppose you are using a three simple moving average system, 10 day SMA, 20 day SMA and 50 day SMA. In an uptrend, a perfect order world be when the 10 day SMA is above the 20 day SMA and the 20 day SMA is above the 50 day SMA. In the same manner, the 100 day SMA should be below the 50 day SMA and the 200 day SMA should be below the 100 day SMA.

Read more

A Successful Start to Forex Trading

Candlestick Chart

In order to start a home business, one must fully analyze their current financial wit and their capabilities. Investment must come with a strong emotional security because it’s important for you to fully understand that your investments come at a high price, there’s always the risk of total failure. Nevertheless, you mustn’t gamble your money away, you’ve got to be prepared, diligent, smart, and very determined.

Read more

Combining Trendlines With Candlestick Patterns To Enter And Exit Trades

Candlestick Chart

Trendline is one of the most easiest to understand technical indicators. Most of the charting software will automatically draw the trend line for you. You can use a bullish trendline and the bullish candlestick patterns to pick long entry points as well as confirm trends. In the same manner, you can use a bearish trendline in conjunction with bearish candlestick patterns for a short entry in the market.

When you combine a bullish trendline with a bullish candlestick pattern or a bearish trendline with a bearish candlestick pattern, you will get a pretty accurate signal that tells whether you should stick with a position or exit it.

Read more

Short Term, Intermediate Term And Long Term Trendlines Are A Useful Tool For Traders

Trading Strategy

Prices trend. Trendlines are drawn by connecting two or more points of support and resistance. An uptrend means a series of price bars or candles exhibiting higher lows, higher highs or higher closes. Similarly, a downtrend means a series of price bars or candles showing lower highs, lowers lows or lower closes.

An uptrend line or support is drawn by connecting the higher lows with a straight line and extending that into the future. Similarly, a downtrend line or resistance is drawn by connecting the lower highs with a straight line and extending that into the future.

Read more

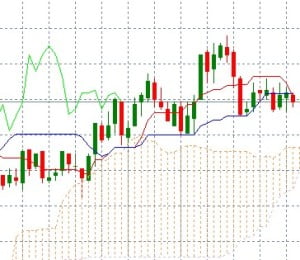
Ichimoku Kinko Hyo – A Unique Trend Trading Indicator

Illustration: Ichimoku Kinko Hyo

Ichimoku Kinko Hyo is a unique trend trading charting system. You will find this Ichimoku Kinko Hyo Indicator to be one of the most versatile and effective trend trading indicators. In fact, it is a full trend trading charting system that you can easily master. It won’t take much of your time and effort. The name may sound intimidating to those unfamiliar with Japanese and a quick glance at the formula makes it appear far more complex than it really is. Despite its intimidating appearance, this is a very simple system.

Ichimoku Kinko Hyo Indicator is surprisingly not a well known indicator. The primary strength of the Ichimoku Kinko Hyo System is that it uses multiple data points to give the trader a deeper and comprehensive picture of the price action. Ichimoku is a very visual system that helps the trader to quickly discern and filter the low probability trade setups from the high probability trade setups.

Read more

Breakout Trading Forex Strategy – Filtering False Breakouts

Illustration: Trading Strategy

Breakout trading can be highly profitable yet at the same time frustrating as many breakouts have a tendency to fail. The main cause behind most of these false breakouts in the forex market is the big players that intentionally cause pairs to breakout in order to suck in non suspecting or inexperienced players.

Breakout trading is all about learning how to avoid trading a false breakout. You need to develop a price filter that can help you screen a false breakout from a true breakout so that you can trade it.

Read more

No Loss Robot

No Loss RobotNo Loss Robot comes out of the blue and announces that it can trade 100% successfully and 100% automatically. That’s certainly an outrageous claim – I’m yet to see a system that is really flawless – that’s impossible. Could it be a play on numbers? You be it is.

But first, the features. No Loss Robot has grown from a manual trading system which was based on trend spotting. The authors claim to have had great success with their system and they have decided to automate the process. As a result the robot is trend based too.

Read more