Never let your profit turn into a loss. In forex trading, a few seconds might be enough for the market to move into the negative territory and wipe out all of the pips gained by you. As a trader, your number one focus after entering into a trade is to determine when to get out. If the position is losing money, you can use the traditional stop loss strategies.
However, suppose your trade is profitable. Seeing profits emerge in your trade is exciting. But the technical challenge is to recognize when to exit a profitable position before your profit turns into a loss. These challenges are real as many traders are unable to get out in time and protect their profit.
You need to learn how to detect the change in market sentiment at the micro level so that you can capture and protect the pips that you had made. Renko Charts can help you detect changes in the market sentiment at the micro level. Let’s discuss how Renko Charts are used by traders to detect market sentiment changes at the micro level.
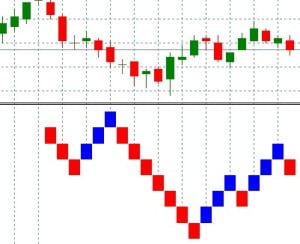
On a Renko Chart, price movements are represented by bricks. Renko is the Japanese word for a brick. If the price moves up by a predetermined amount, we add a brick to the chart. The color of the brick is usually white, gray or green. However, you can select your own color.
Similarly when the price moves down by a predetermined amount, we add a new brick in the opposite direction that is usually colored red or black. However, you are free to select your own color. Each brick on the Renko Chart reveals information about the market sentiment at the various points in time. These bricks can be used by the trader as a way to identify the threats to the pips that have been gained so far in the market.
By setting these Renko Chart bricks to a small micro level price increment like 1 pip, a trader can get the earliest possible warning to the change in the market sentiment. This micro level of trading can be 1 minute or less.
On a Renko Chart, a bullish renko pattern is recognizable as a sequence of bullish bricks colored green, white or gray moving up. Similarly, a bearish renko pattern will be recognized as a descending series of black or red bricks. A general rule of thumb is to take three bricks in the reverse direction as the threshold. On the appearance of the fourth brick, exit half of the position and on the appearance of the fifth brick exit the market fully.
Renko charts are used in intra hour and intra day trading. Renko charts are very helpful in scalping. The above renko trading rule provides zero tolerance for having a profit turn into a loss. Always remember as a trader your focus should be to never let a profit turn into a loss. Renko charts can help you protect your profits by giving you a very clear picture of how the trend is changing at the micro level!
Great post! you have explain the Renko trading Strategy very clean and to the point.
I’m not using Renko but know about this. I thought Renko’s only used by the stock trader to trade stocks or option but this post of yours has open my eyes of its use for the forex.
Great job
thank you Ahmed for explaining Renko trading Strategy you realy did that very well so iam gonna enhance my strategy with it great work
Thanks Ahmed! Nice explanation of Renko trading strategy. Really liked it!