The purpose of this page is to encourage and collect the user reviews of a Forex product called Stealth Forex System. To get the details about this product (such as its features) or if you’re looking for support, please visit the official website that can be found at stealthforex.net.
indicator
Forex 50 Pips
The purpose of this page is to encourage and collect the user reviews of a Forex product called Forex 50 Pips. To get the details about this product (such as its features) or if you’re looking for support, please visit the official website that can be found at forex50pips.net.
InForex
The purpose of this page is to encourage and collect the user reviews of a Forex product called InForex. To get the details about this product (such as its features) or if you’re looking for support, please visit the official website that can be found at http://inforex.pattern-watcher.com/.
How to Apply the Fibonacci Retracement Tool Correctly?

The Fibonacci retracement tool is one of those tools in forex that a forex trader simply cannot do without. This is because in the financial markets, prices do not move in a continuous straight line, but in a convoluted twist of pullbacks and advances. Whenever the price action of a currency has moved substantially in a particular direction due to a very strong trend, those traders who were able to get in early would at some point, decide to take some profits from their trades. This will place the gaining currency on offer and will lead to a supply excess over demand for that currency at that particular time, leading to price pullbacks.
Using Parabolic SAR Indicator for Entry and Exit

In this article, we will discuss how to use the Parabolic SAR indicator for entry and exit in actual trading. When the dots of the Parabolic SAR are located below the price, it means the trend is up and the price momentum is also in an upward direction and will stay like that till the price action hits Parabolic SAR. This is also a signal for a long trade.
When the price action is below the dots of the Parabolic SAR, it means that the trend is down and the price momentum is also in a downward direction and will stay like that till price action hits the Parabolic SAR. This is also a signal for a short trade. The dots will move down as a trailing stop.
Understanding Parabolic SAR Indicator
Parabolic SAR is a trend following indicator that is often used as a trailing stop. Parabolic SAR indicator was introduced in 1978 by J. Welles Wilder, Jr. in his famous book, “New Concepts in Technical Trading Systems.”The term Parabolic is used because when this indicator is applied to the chart it forms strings of dots that look like a parabola, a shape you might remember from high school algebra.
The term SAR on the other hand simply means Stop and Reverse because when reached by price action, this indicator switches direction and reverses to the other direction. So a Parabolic SAR is used to identify entry and exit points based on a trailing stop that reverses when reached by the price action.
Ultra Fast Profit
The purpose of this page is to encourage and collect the user reviews of a Forex product called Ultra Fast Profit. To get the details about this product (such as its features) or if you’re looking for support, please visit the official website that can be found at ultrafastprofit.net.
TrueTL – True Trendline Indicator
The purpose of this page is to encourage and collect the user reviews of a Forex product called TrueTL – True Trendline Indicator. To get the details about this product (such as its features) or if you’re looking for support, please visit the official website that can be found at truetl.com.
Super Buy Sell Profit
The purpose of this page is to encourage and collect the user reviews of a Forex product called Super Buy Sell Profit. To get the details about this product (such as its features) or if you’re looking for support, please visit the official website that can be found at superbuysellprofit.net.
Auto Trend Forecaster
The purpose of this page is to encourage and collect the user reviews of a Forex product called Auto Trend Forecaster. To get the details about this product (such as its features) or if you’re looking for support, please visit the official website that can be found at autotrendforecaster.net.
Forex Fractal Breakout
The purpose of this page is to encourage and collect the user reviews of a Forex product called Forex Fractal Breakout. To get the details about this product (such as its features) or if you’re looking for support, please visit the official website that can be found at forexfractalbreakout.com.
Forex Power Group
The purpose of this page is to encourage and collect the user reviews of a Forex product called Forex Power Group. To get the details about this product (such as its features) or if you’re looking for support, please visit the official website that can be found at winnersedgetrading.com.
Elemental Trader
This is an entry for a Forex product called Elemental Trader. The official site for this product is at elementaltrader.com. If you’re looking for more info about this product follow the link.
Trading Price Oscillator Divergences Can Increase Your Chances Of Making Winning Trades

Trading divergence patterns is not a complete trading strategy rather it is an additional tool in the technical trading toolkit of any trader. Divergence is simply the disagreement between the price action and the indicator movement.
Now any oscillator can be used to show divergence patterns. The most commonly used oscillators include RSI, Stochastics, MACD, CCI, ROC and Williams %R. However, any oscillator can show divergence with price action.
MACD Divergence And Crossover
First read the article on the Moving Average Convergence Divergence (MACD) to know what is the MACD black line and the signal or the trigger grey line and plus what is a MACD histogram. When the MACD line crosses above the signal line or the trigger line, this is known as the MACD cross or a Moving Average Crossover. When the MACD line is above the trigger line, it supports a long position and when the MACD line is below the trigger line, it supports a short position.
Moving Average Convergence Divergence (MACD) Is A Simple Yet Reliable Forex Indicator
The Moving Average Convergence/Divergence (MACD) is a versatile indicator. Moving Average Convergence/Divergence is one of the simplest and most reliable forex indicators. MACD will help you identify both the bull divergence as well the bear divergence which are rare but effective patterns.
This is a hybrid tool that is helpful in determining the present market direction as well as measure the price momentum. Many traders use MACD as their sole confirming indicator. This multi faceted indicator acts as a sign of the trend momentum by representing the relationship between the two moving averages.
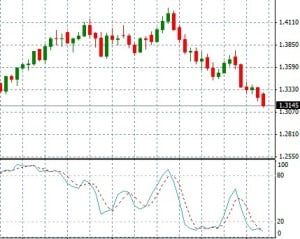
Divergence Trading Using Stochastics

One of the most popular ways to use Stochastics is divergences. A divergence takes place when the price and the stochastics diverge from following the same path. For example, if the price makes a new low but the stochastics don’t, it is a divergence. In the same way, if the stochastics make a new high and the price doesn’t, it is again a divergence.
Now, keep this in mind that divergence on a daily chart is quite different than the divergence on the weekly chart. Divergence on the daily chart means that the price will make a short term counter trend move in the next one to five days.
Stochastics For Forex Traders
Stochastics is one of the most popular indicators in forex trading. You can find it on almost all platforms and charting services. But most traders use them incorrectly. Stochastics is an oscillator that has two components %K and %D. This is the formula to calculate K=100(C-L)(H-L) where C is the Close, H High and L the Low of the period. Typically this period is 14 days. However, 9 days period is also popular. %K is the 3 day MA of K and %D is the 3 day MA of %K.
Fortunately, you don’t have to go into all this maths unless you want to fiddle with it and see if you can make it work better. One common question is how many days to use in Stochastics. Stick with 14 days as it is the default. Longer period means lesser signals and lower whipsaw while shorter periods means more signals and more whipsaw.
Commodities Channel Index Breakout Strategy
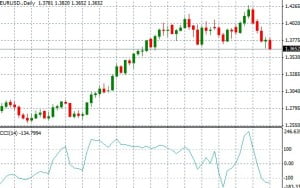
Commodities Channel Index (CCI) is an oscillator that measures the strength of the current market cycle and attempts to predict when it will end. CCI indicator default measurements are +100 to -100. When the indicator is above +100, the market is considered to be overbought and when it is below -100, the market is considered to be oversold.
Commodities Channel Index breakouts occur when it falls below +100 or rises above -100. Most traders are taught to buy when the breakout from the oversold market takes place and sell when the breakout from the overbought market condition takes place. In this CCI Breakout Trading Strategy, we will be using a variation of this by combining the Commodities Channel Index Breakouts with our usual support and resistance on the Daily Charts.
Black Diamond Trader
This is an entry for a Forex product called Black Diamond Trader. The official site for this product is at blackdiamondtrader.com. If you’re looking for more info about this product follow the link.
Ichimoku Kinko Hyo – A Unique Trend Trading Indicator
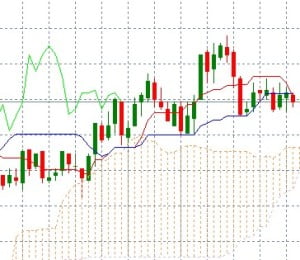
Ichimoku Kinko Hyo is a unique trend trading charting system. You will find this Ichimoku Kinko Hyo Indicator to be one of the most versatile and effective trend trading indicators. In fact, it is a full trend trading charting system that you can easily master. It won’t take much of your time and effort. The name may sound intimidating to those unfamiliar with Japanese and a quick glance at the formula makes it appear far more complex than it really is. Despite its intimidating appearance, this is a very simple system.
Ichimoku Kinko Hyo Indicator is surprisingly not a well known indicator. The primary strength of the Ichimoku Kinko Hyo System is that it uses multiple data points to give the trader a deeper and comprehensive picture of the price action. Ichimoku is a very visual system that helps the trader to quickly discern and filter the low probability trade setups from the high probability trade setups.
High Velocity Market Master
 High Velocity Market Master is a trading system and video course by NetPicks Trading for beginners and advanced traders alike. It works with Forex, stocks, futures, and options markets.
Forex Kagi
 Forex Kagi is a manual trading system with an indicator based on Kagi charts, an old Japanese trading technique. The system combines an old strategy with the new Neural Adaptive Technology for an indicator to produce signals.
Fibonacci Killer
 Fibonacci Killer is a manual trading system that works not only on Forex trading but also stocks and bonds. In Forex trading, it works with multiple currency pairs under any market conditions, it is platform and broker independent.
Forex Rebellion
 Forex Rebellion is a manual Forex trading system comprised of unique indicators and money management system. It is endorsed and verified by the Surefire Trading Challenge and tested by numerous beta testers to get an average success rate of 80% – they report profits from 35% to 130% in four weeks of trading with the system.
Forex Counter Attack
This is an entry for Forex Counter Attack. Please leave your comments or reviews below. If you want to submit …