Stochastics is one of the most popular indicators in forex trading. You can find it on almost all platforms and charting services. But most traders use them incorrectly. Stochastics is an oscillator that has two components %K and %D. This is the formula to calculate K=100(C-L)(H-L) where C is the Close, H High and L the Low of the period. Typically this period is 14 days. However, 9 days period is also popular. %K is the 3 day MA of K and %D is the 3 day MA of %K.
Fortunately, you don’t have to go into all this maths unless you want to fiddle with it and see if you can make it work better. One common question is how many days to use in Stochastics. Stick with 14 days as it is the default. Longer period means lesser signals and lower whipsaw while shorter periods means more signals and more whipsaw.
Stochastics is the measure of the close as related to the high and the low. It calculates the percent distance of the close to the range. Stochastics is often used as an overbought and oversold indicator. Typically when the Stochastics moves above 80, the market is overbought and when it moves below 20, the market is oversold. But, selling when it is above 80 and buying when it is below 20 is a money losing strategy.
This is due to the fact that the overbought and the oversold condition only works during a sideways market or a mildly trending market but it falls apart completely when the market is in a strong trend. Due to this fact, many traders only buy when the stochastics get above 80 and the %K crosses down below the %D and sell when the stochastics get below 20 and the %K crosses above the %D. Whatever, there is a better way to trade using Stochastics.
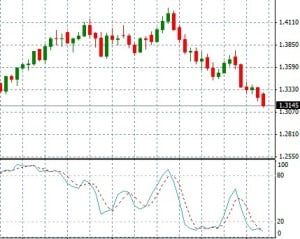
This strategy involves trading the %D and %K crossovers. %D is the slower moving line while the %K is the faster moving line. The best signals come when these crossovers happen when the stochastics is above the 80 line or below the 20 line.
When the %K crosses %D when it is still climbing, it is called Left Handed Crossover. The Right Handed Crossover occurs when %K crosses from the right side of the hump of %D. A right handed crossover will only occur when the market stabilizes first and then starts to drop. Many traders consider the right handed crossover as the more accurate signal.