Ichimoku Kinko Hyo is a unique trend trading charting system. You will find this Ichimoku Kinko Hyo Indicator to be one of the most versatile and effective trend trading indicators. In fact, it is a full trend trading charting system that you can easily master. It won’t take much of your time and effort. The name may sound intimidating to those unfamiliar with Japanese and a quick glance at the formula makes it appear far more complex than it really is. Despite its intimidating appearance, this is a very simple system.
Ichimoku Kinko Hyo Indicator is surprisingly not a well known indicator. The primary strength of the Ichimoku Kinko Hyo System is that it uses multiple data points to give the trader a deeper and comprehensive picture of the price action. Ichimoku is a very visual system that helps the trader to quickly discern and filter the low probability trade setups from the high probability trade setups.
This unique indicator was invented by a Japanese journalist Goichi Hosada in 1969. The Ichimoku Kumo or Cloud is the very core of this system. The Ichimoku Cloud computations are deceptively simple and when put together they synthesize data in an amazingly effective way. Ichimoku Indicator will enable you to immediately distinguish the prevailing trend and the relationship of the actual price with regard to that trend. It will provide you with a multi dimensional view of the support and resistance as compared to just a simple one-dimensional level that is provided by most of the other charting systems. This will give you a much better understanding of how the market truly functions with support and resistance as not just points or lines on the charts but rather as areas that expand and contract depending on the market dynamics.
In other words, with this one indicator alone you can define support and resistance, identify trend direction, measure momentum and get trading signals. Can you find any other indicator more versatile than this one? I don’t think so. You can use this indicator in stock trading as well as forex trading with ease. It’s not that complex. Let’s discuss it in more detail.
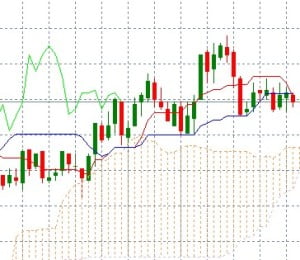
There are five plots in the Ichimoku Cloud:
- Tenkan-sen also known as the Conversion Line
- Kijun-sen which can also be called the Baseline
- Senkou Span which is Leading Span A
- Senkou Span which is Leading Span B
- Chikou Span which is the Lagging Span.
This is how these five plots are calculated;
Conversion Line = (9-Period High+9-Period Low)/2
Baseline = (26-Period High+26-Period Low)/2
Leading Span A = (Conversion Line+Baseline)/2
Leading Span B = (52-Period High+52-Period Low)/2
Lagging Span = Close Plotted 26 days in the past.
The most important plots are the Leading Span A and the Leading Span B. When prices move above the baseline or the Conversion Line moves above the baseline, it is taken as a bullish signal. Similarly when the prices or the conversion line move below the baseline, it is a bearish signal. This indicator works best on the daily and weekly charts. You can use this indicator on your MT4 Platform.