Fibonacci and Online FX Trading offers the capacity not only to react promptly to market change but to react using an online platform which has the necessary strategic resources. The Fibonacci pattern is a well regarded mathematical sequence and can be applied to the forex way of thinking.
The foreign exchange market, aptly known as forex is the biggest financial market in the world and as a result the sheer level of variables, opens a vast array of possibility regarding technical analysis and trading patterns.
The Fibonacci sequence was devised by the Italian mathematician Leonardo Fibonacci. The mathematician did not initially discover the Fibonacci sequence but his successful implementation of the method, in Liber Abaci ensured his namesake went down in history.
So how can a sequence of numbers originally devised on an experimental level to calculate the population of rabbits be applied to today’s contemporary forex marketplace? To apply the forex principle, a trader must first acknowledge the basic mathematical assumption of Fibonnaci. Within a Fibonacci sequence of numbers the sum of the two previous numbers equals the next. The sequence begins with 0 and 1. An example sequence is as follows 0, 1, 1, 2, 3, 5, 8, 13, 21. It is based on a fusion of both past and present and it is this key principle which can be applied to the financial markets.
The financial application of the Fibonacci sequence takes the form of Fibonacci retracement. Retracement is based on a simple idea – the markets will retrace previous patterns just as the sum of the previous numbers is used to predict the next number within the Fibonacci sequence above.
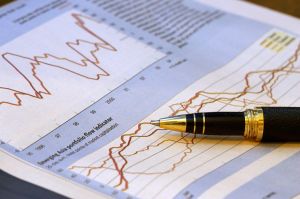
A technical chartist interpretation of data using Fibonacci will take two extreme points on a graph, perhaps the highest and lowest figure across a specified time period. The distance between these two points is then divided by the Fibonacci ratio. Technical analysts use this line of Fibonacci retracement to extract market support and resistance. The levels of support reflect bullish market behavior and the levels of resistance tend to reflect bearish market sentiment.
The analysis does have a significant draw back in that it relies on choice to instigate the sequence. Selecting, two ‘extreme points’ on a graph is open to interpretation and the notion of choice regarding these specific points leaves the graph exposed to variables. In a sense Fibonnaci will always retain a sense of importance within the financial markets as the more price behavior around the Fibonnaci ratio is monitored, the more this form of analysis becomes a self fulfilling prophecy.
Online FX trading provides a way of not only visualizing charting data but also reacting accordingly, IG Markets provides a wide range of forex options and associated technical analysis. Forex trading can incur significant loss. The above information should not be construed as financial advice.